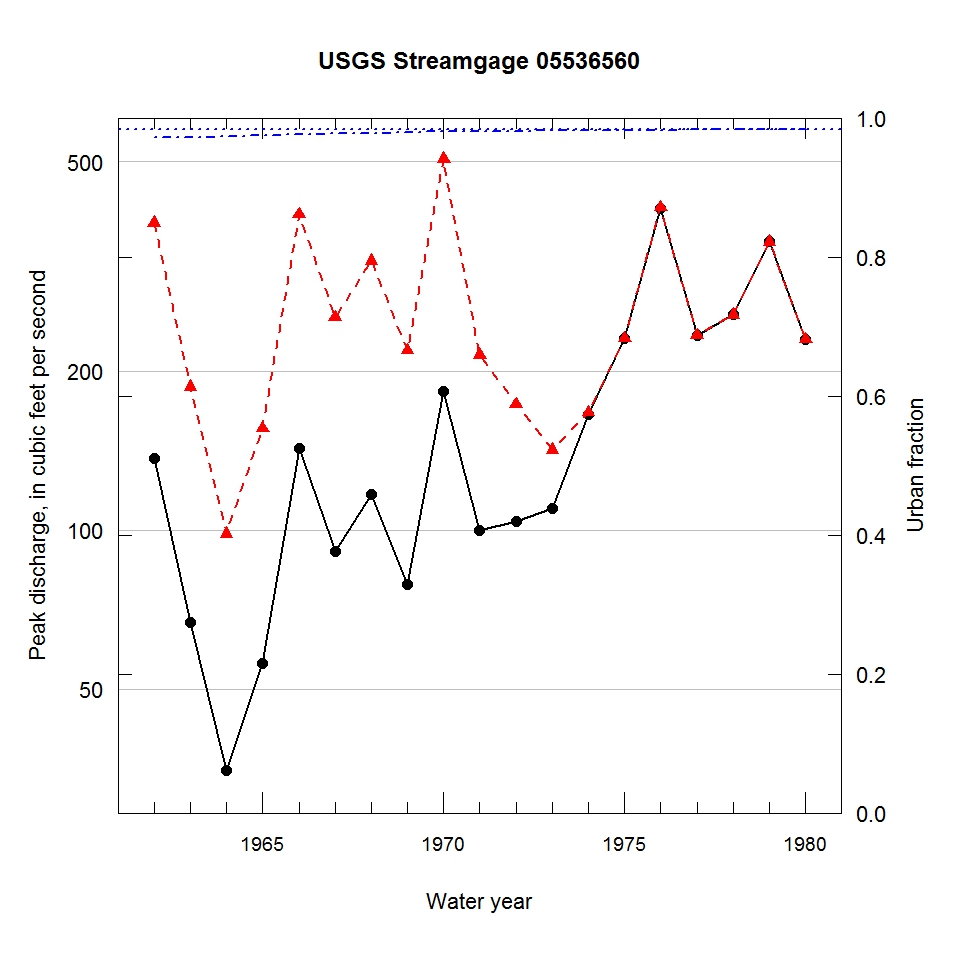
Observed and urbanization-adjusted annual maximum peak discharge and associated urban fraction and precipitation values at USGS streamgage:
05536560 MELVINA DITCH NEAR OAK LAWN, IL


| Water year | Segment | Discharge code | Cumulative reservoir storage (acre-feet) | Urban fraction | Precipitation (inches) | Observed peak discharge (ft3/s) | Adjusted peak discharge (ft3/s) | Exceedance probability |
| 1962 | 1 | -- | 0 | 0.972 | 0.283 | 137 | 382 | 0.140 |
| 1963 | 1 | 2 | 0 | 0.973 | 1.608 | 67 | 187 | 0.776 |
| 1964 | 1 | 2 | 0 | 0.974 | 0.783 | 35 | 98 | 0.983 |
| 1965 | 1 | 2 | 0 | 0.975 | 0.496 | 56 | 156 | 0.895 |
| 1966 | 1 | -- | 0 | 0.976 | 1.591 | 143 | 397 | 0.121 |
| 1967 | 1 | -- | 0 | 0.977 | 1.179 | 91 | 253 | 0.493 |
| 1968 | 1 | -- | 0 | 0.978 | 1.507 | 117 | 324 | 0.227 |
| 1969 | 1 | -- | 0 | 0.979 | 0.735 | 79 | 219 | 0.634 |
| 1970 | 1 | -- | 0 | 0.981 | 1.232 | 183 | 505 | 0.045 |
| 1971 | 0 | -- | 165 | 0.981 | 0.452 | 100 | 215 | 0.656 |
| 1972 | 0 | -- | 165 | 0.981 | 1.142 | 104 | 173 | 0.830 |
| 1973 | 0 | -- | 165 | 0.982 | 1.272 | 110 | 142 | 0.932 |
| 1974 | 2 | -- | 165 | 0.982 | 1.012 | 166 | 167 | 0.856 |
| 1975 | 2 | -- | 165 | 0.982 | 1.361 | 231 | 231 | 0.575 |
| 1976 | 2 | -- | 165 | 0.983 | 0.983 | 408 | 409 | 0.106 |
| 1977 | 2 | -- | 165 | 0.983 | 1.566 | 234 | 234 | 0.564 |
| 1978 | 2 | -- | 165 | 0.983 | 1.025 | 256 | 256 | 0.478 |
| 1979 | 2 | -- | 165 | 0.984 | 1.164 | 352 | 352 | 0.179 |
| 1980 | 2 | -- | 165 | 0.984 | 1.022 | 230 | 230 | 0.581 |

